MACD (moving average convergence/divergence) is a well-know technical indicator based on relation of two moving averages (MA) of price. This indicator is related to both trend indicators and oscillators. Notwithstanding it was first reported by Gerald Appel as early as in the end on 1970-s, this indicator is still popular today. Let's figure out why it gained popularity among traders, which useful information it provides and what are its pros and cons.
Two types of MACD are distinguished: linear and bar chart. Let's consider each of them separately.
Linear MACD
Measurement formula is rather easy. To get a precise value, the difference between exponential MA with a short period and exponential MA with a long period is taken. To filter random market splashes, result must be smoothed with MA.
MACD = EMA (P, N) - EMA (P, N)
SIGNAL = SMA (MACD, N)
where:
EMA - exponential MA;
SMA — simple MA;
SIGNAL — smoothing MA, indicator's signal line;
N — the number of periods;
P – price of current period (can be Close, Open, High, Low, Median Price, Typical Price).
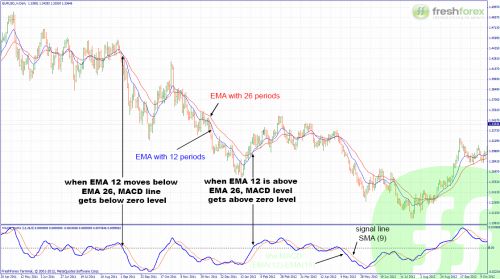
It has the following chart representation (parameters by default: 12,26,9)
MACD bar chart
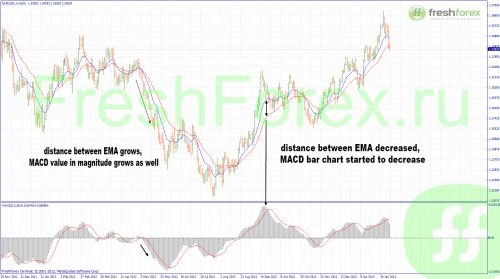
For illustration purposes, MACD line is represented as bar chart (should not be mixed with OsMA bar chart). Essentially, it gives the same value of difference between moving averages represented as rectangular. When fast EMA is above slow one, bar chart is above zero (positive). When fast EMA is below slow one, bar chart is below zero (negative). With the increase (decrease) in distance between moving averages, each column of bar chart will respectively be more (less) than the previous one in magnitude.
Thus, structure of the indicator is now clear. Then we will move to trading signals conveyed by MACD.
MACD crosses SMA signal line. When bar chart gets below signal line, you need to sell, and when it is above signal line, it is time to buy.
Bar chart crosses zero line. Crossing of zero from top to bottom is a signal for sell, from bottom to top says about time to buy. On the chart it will be represented by cross of moving averages.
It is also noteworthy that under location of MACD below zero, we have descending tendency and when MACD is above zero, tendency is ascending.
MACD is often used as oversold/overbought indicator. When bar chart value is too high or low, return to more real values is expected.
Divergence/convergence means divergence or convergence of the indicator towards price chart. There is a bullish divergence and bearish convergence.
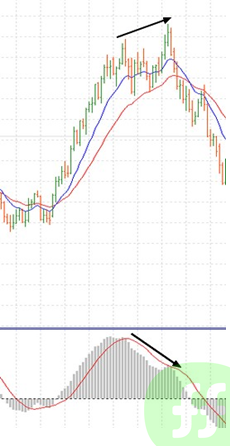
Bullish divergence emerges when a higher maximum of price is not confirmed by a higher maximum pursuant to MACD.
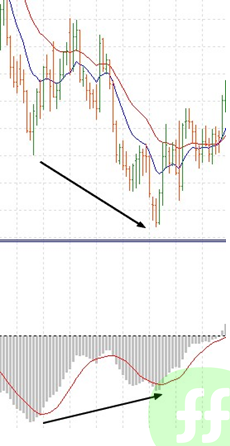
Bearish convergence emerges when a lower minimum of price is not confirmed by a lower minimum pursuant to MACD.
Divergence/convergence more often says about weakness of trend and possible correction or reversal. Despite this fact, divergence/convergence figure is not recommended to use as the indicator for opening positions against trend. The reason is that market often makes repeated (triple and more frequent) divergence/convergence movements. In conclusion we will consider pros and cons of MACD.
Vantages:
MACD is rather good in showing a general market tendency and entrances aimed on trend can bring a high profit. Divergence of the indicator warns about weakness of tendency and possible correction beforehand.
Drawbacks:
Linear MACD is delayed over formation of trading signals. MACD (linear and bar chart) conveys plenty false signals on time frames below Daily. MACD bar chart is unreliable as the overbought/oversold indicator.
It also should be taken into consideration that the smaller parameters are set for MA, the more false signals will be sent. Bigger parameters will lead to omission of signals. Any trader can try out the indicator's parameters and select the best possible combination for strategy. For example, a famous trader Bill Williams successfully applied his combination (5,34,5) instead of standard preferences (12,26,9).
How to use MACD Indicator
In the Moving Average Convergence-Divergence (MACD) indicator, convergence is the norm and divergence is an anomaly. As an anomaly, a divergence holds no power over convergence. A divergence is simply an unexpected event and is purposed to be overlapped by another convergence. Thus, it is a mistake to treat divergence as a signal for an impending change in trend. Divergence is a sign that there might be a change in price movement. It doesn't matter if divergence is Bullish or Bearish or Hidden. A divergence is a divergence, nothing more.
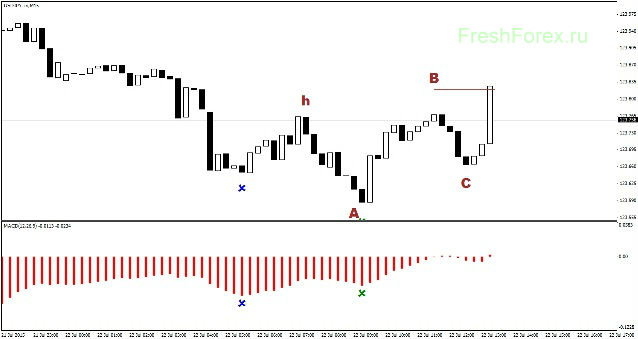
What's more important in MACD is price behavior following right after any divergence, because that is the true signal. Check how it is shown on the below chart:
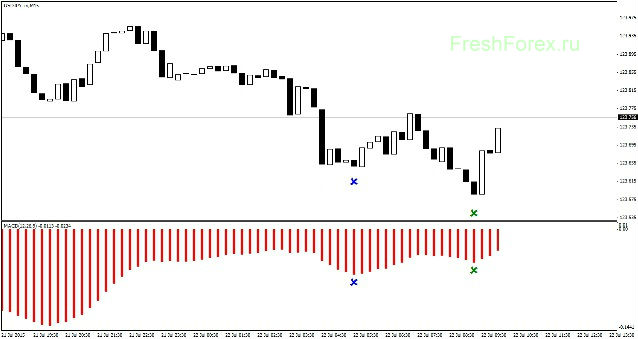
On the above chart, the points marked by blue and green x clearly show a Regular Bullish Divergence – which usually means that an upward change in trend is impending. Whether it is true or not, how price behaves afterward will either confirm or counter the interpretation.
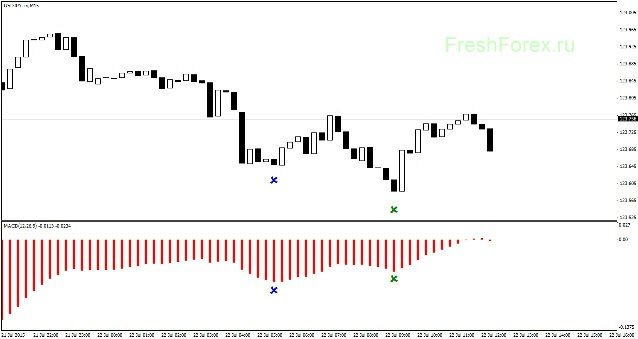
Several later candles of the price show the beginning of a down movement:
To make the discussion easier, let's put some notes on it. So, the chart will look like this:
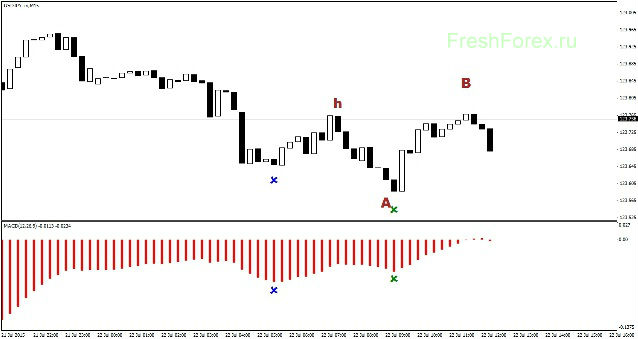
The true signal of MACD is the price movement between A and B and beyond. In this chart, where point A and B are just little longer than point h (the last highest) to A, this is an indication that an opportunity to trade does exist. If length of A-B is at least twice of h-A or more, then the signal is not as strong as the one showed in the chart above. And when length of A-B is triple or longer, then the opportunity does not exist.
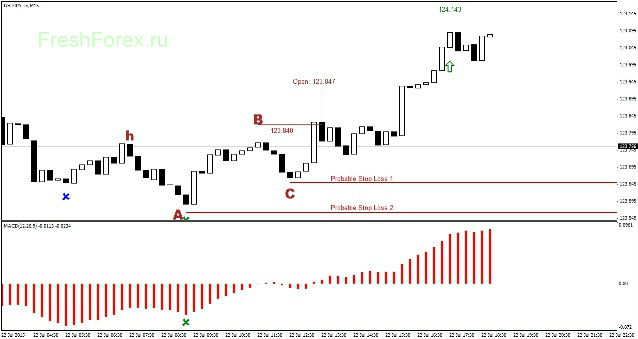
Naturally, price movement beyond point B must come to another turning point – or point C. And while price moves towards point C, point A and B become the trigger level. In other words, by this time, a trader can place a pending order at point A and B (Sell Stop and Buy Stop respectively). And price will reveal itself if the next convergence is upward or downward.
If it is downward, then point C will be formed below point A (by that time Sell Stop order at point A is already executed). If it is upward, then point C will be formed somewhere between points A and B before reversal of price and execute Buy Stop order at point B.
As it turns out, point C is formed between A and B:
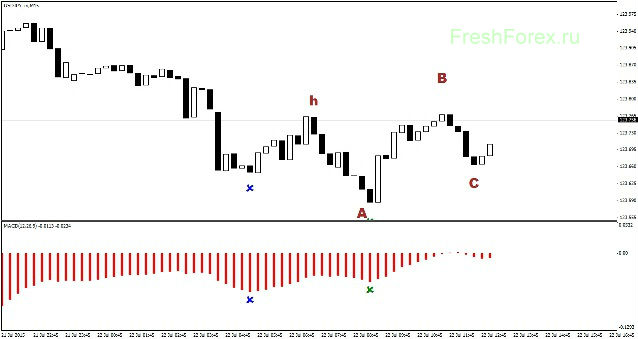
and then price moves upward and executes Buy Stop order at point B.
Alternatively, market order can be used instead of pending order. When price is definitely closed beyond point A-B, as above, a market buy order can be placed at the next opened candle.
Stop Loss then can be placed either at point A, or below point C.
For target profit, length of A to B can be used as an alternative to lock in profit of 25 to 30 pips.
And, a few hours later, everything is confirmed as shown by the chart below:
Trade Forex CFDs with Plus500
Trade the most popular forex pairs like EUR/USD, GBP/USD and EUR/GBP at Plus500. Use our advanced trading tools to protect your profits and limit losses. Trade forex with up to 1:300 leverage. With as little as 100$ you can gain the effect of 30 000$ capital! Use our trading tools such as Stop Loss, Stop Limit and Guaranteed Stop to limit losses and lock in profits. Get FREE real-time forex quotes and set indicators to easily analyse charts.
What is Forex and how does Forex trading work?
Forex trading (also commonly known as Foreign Exchange, currency or FX trading) is a global market for trading one country’s currency in exchange for another country's currency. It serves as the backbone of international trade and investment: imports and exports of goods and services; financial transactions by governments, economic institutions or individuals; global tourism and travel – all these require the use of capital in the form of swapping one currency for a certain amount of another currency.
When trading Forex CFDs, you are essentially speculating on the price changes in their exchange rate. For example, in the EUR/USD pair the value of one Euro (EUR) is determined in comparison to the US dollar (USD), and in the GBP/JPY pair the value of one British pound sterling (GBP) is quoted against the Japanese yen (JPY).
If you think the exchange rate will rise you can open a ‘Buy’ position. Conversely, if you think the exchange rate will fall you can open a ‘Sell’ position.
To see a full list of currency pairs offered by Plus500, click here.
How do you start trading Forex CFDs?
To start trading commodities with Plus500, simply:
- Sign up / Log in to your account.
- Search for the instrument you want to trade.
- Click the 'Buy' or 'Sell' button depending on the direction you think the commodity will move.
- Open a trade.