Comprehensive and super-easy-to-use live stocks chart that track the movements of thousands of stocks. We delivers the charts, tools and resources you need to succeed in the markets.
See the markets more clearly, improve your portfolio management, and find promising new opportunities faster than ever before. We makes it easy to create the web's highest-quality financial charts in just a few simple clicks.
Create bigger, better, more advanced charts and save them.
The entire Free Charts interface can be divided into parts:
The top menu looks like this:

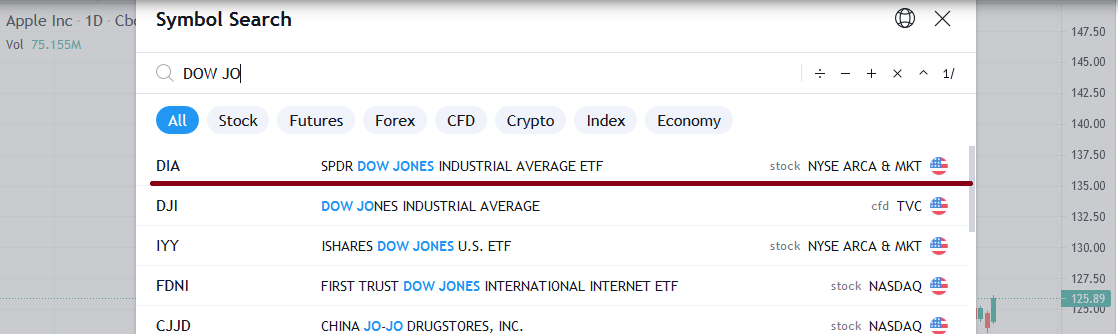
- Selection of an asset (stocks, currency pairs, indices, etc).
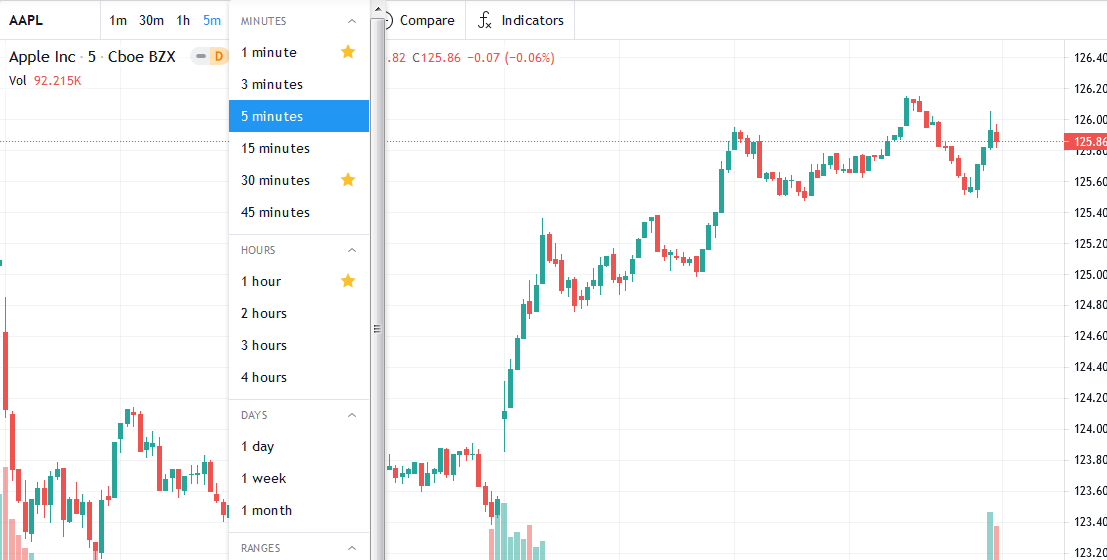
- Timeframe.
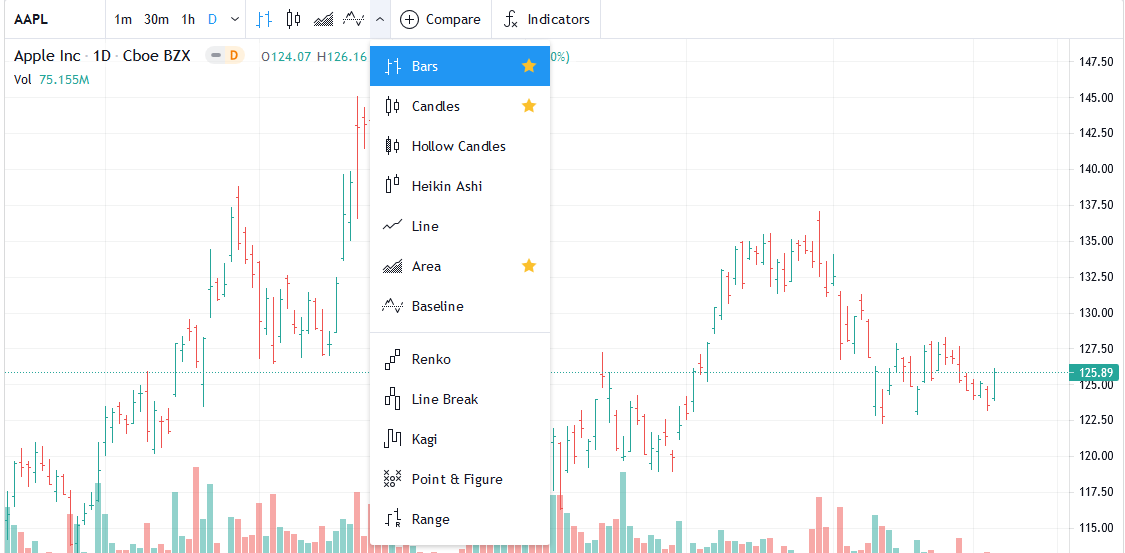
- Chart type (candles, bars, line).
- Comparison of different assets.
- Indicators and scripts.
Main menu - you need to select the asset with which you will work. Start entering its first letters and a menu for selection will appear.
2. Timeframes
Timeframe (TF) is a way to streamline price movement over a timeframe. For example, if you choose 5 minutes, then each candlestick or bar will form on the chart for exactly 5 minutes. Ended up - a new candle begins to draw.
3. Choosing a chart type
Just a choice of what you are comfortable with - candles, bars or a line chart. Japanese candlesticks are set by default - the most popular option.
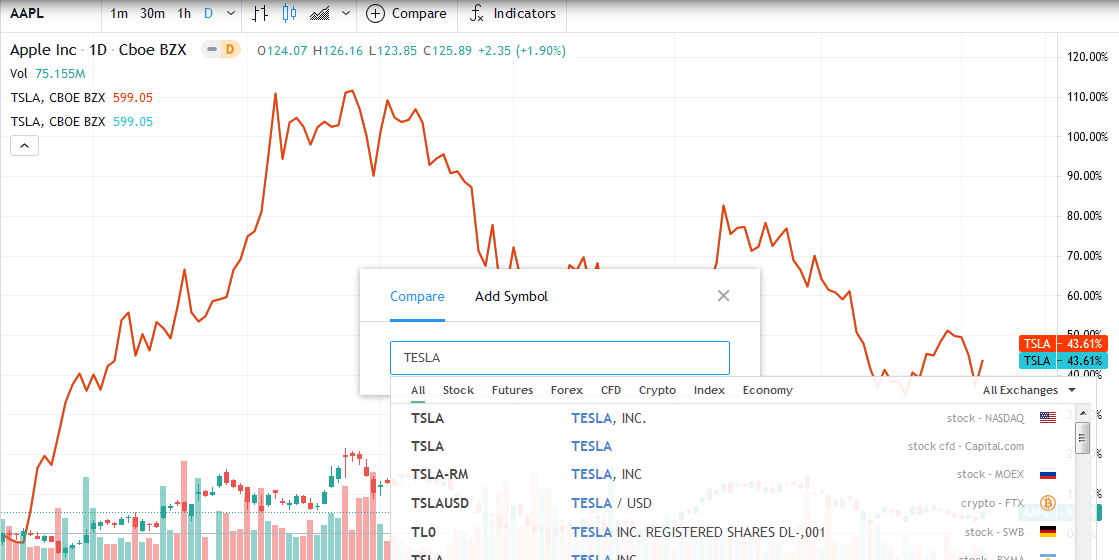
4. Comparison
Compare panel, which allows you to check if there is a correlation between different assets right on the same chart. Let's say you need to compare the movement of Apple and Tesla shares on the same chart.
We already have Apple stocks selected, click on Compare and add Tesla stocks by entering its ticker and clicking on the plus sign:
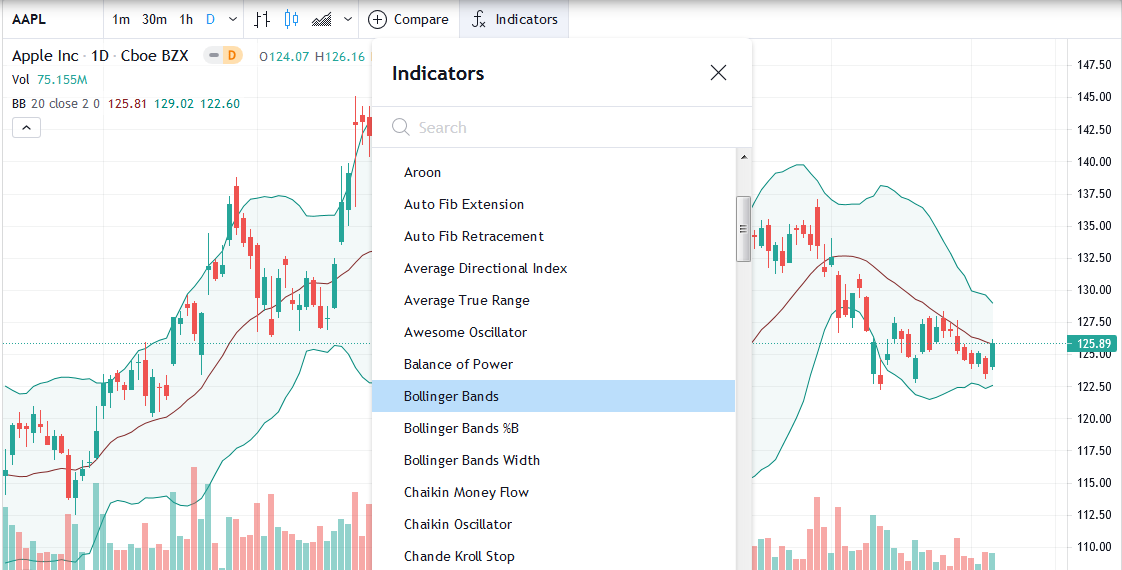
5. Indicators
Probably the most popular free charting menu. It contains all the most popular technical indicators in the world, from Bollinger Bands to Woodies CCI.
Just click on the indicator and it will be added to the chart. Let's add the most popular one - Bollinger Bands.
The markets won't stop because you're away from your desk. You need a real-time charting platform that goes where you go - anywhere, anytime, on any device.
Built for the modern investor, we puts the industry's best technical tools and resources at your fingertips, with no software to install or frustrating compatibility issues. Whether you're on a desktop, laptop, smartphone or tablet, access everything in seamlessly from any web-enabled device.
If you want to please advanced chartists, give them all available drawings - there are over 100 of them! You can also add indicators that will appear by default on the widget. Of course, you can also let your chartists use the 100+ technical indicators that are included.
Our charts are intuitive for beginners, yet have everything advanced investors could wish for. Whether you'd like to simply look up the latest stock price, or analyze price patterns with lengthy scripts — we got you covered.
Our charts is reliably connected to hundreds of data feeds with direct access to stocks, futures, all major Indices, Forex, Bitcoin, and CFDs. Add financial and alternative data to the mix, plus professional news and economic calendars and you'll get a depth of coverage not available on any other public platform.